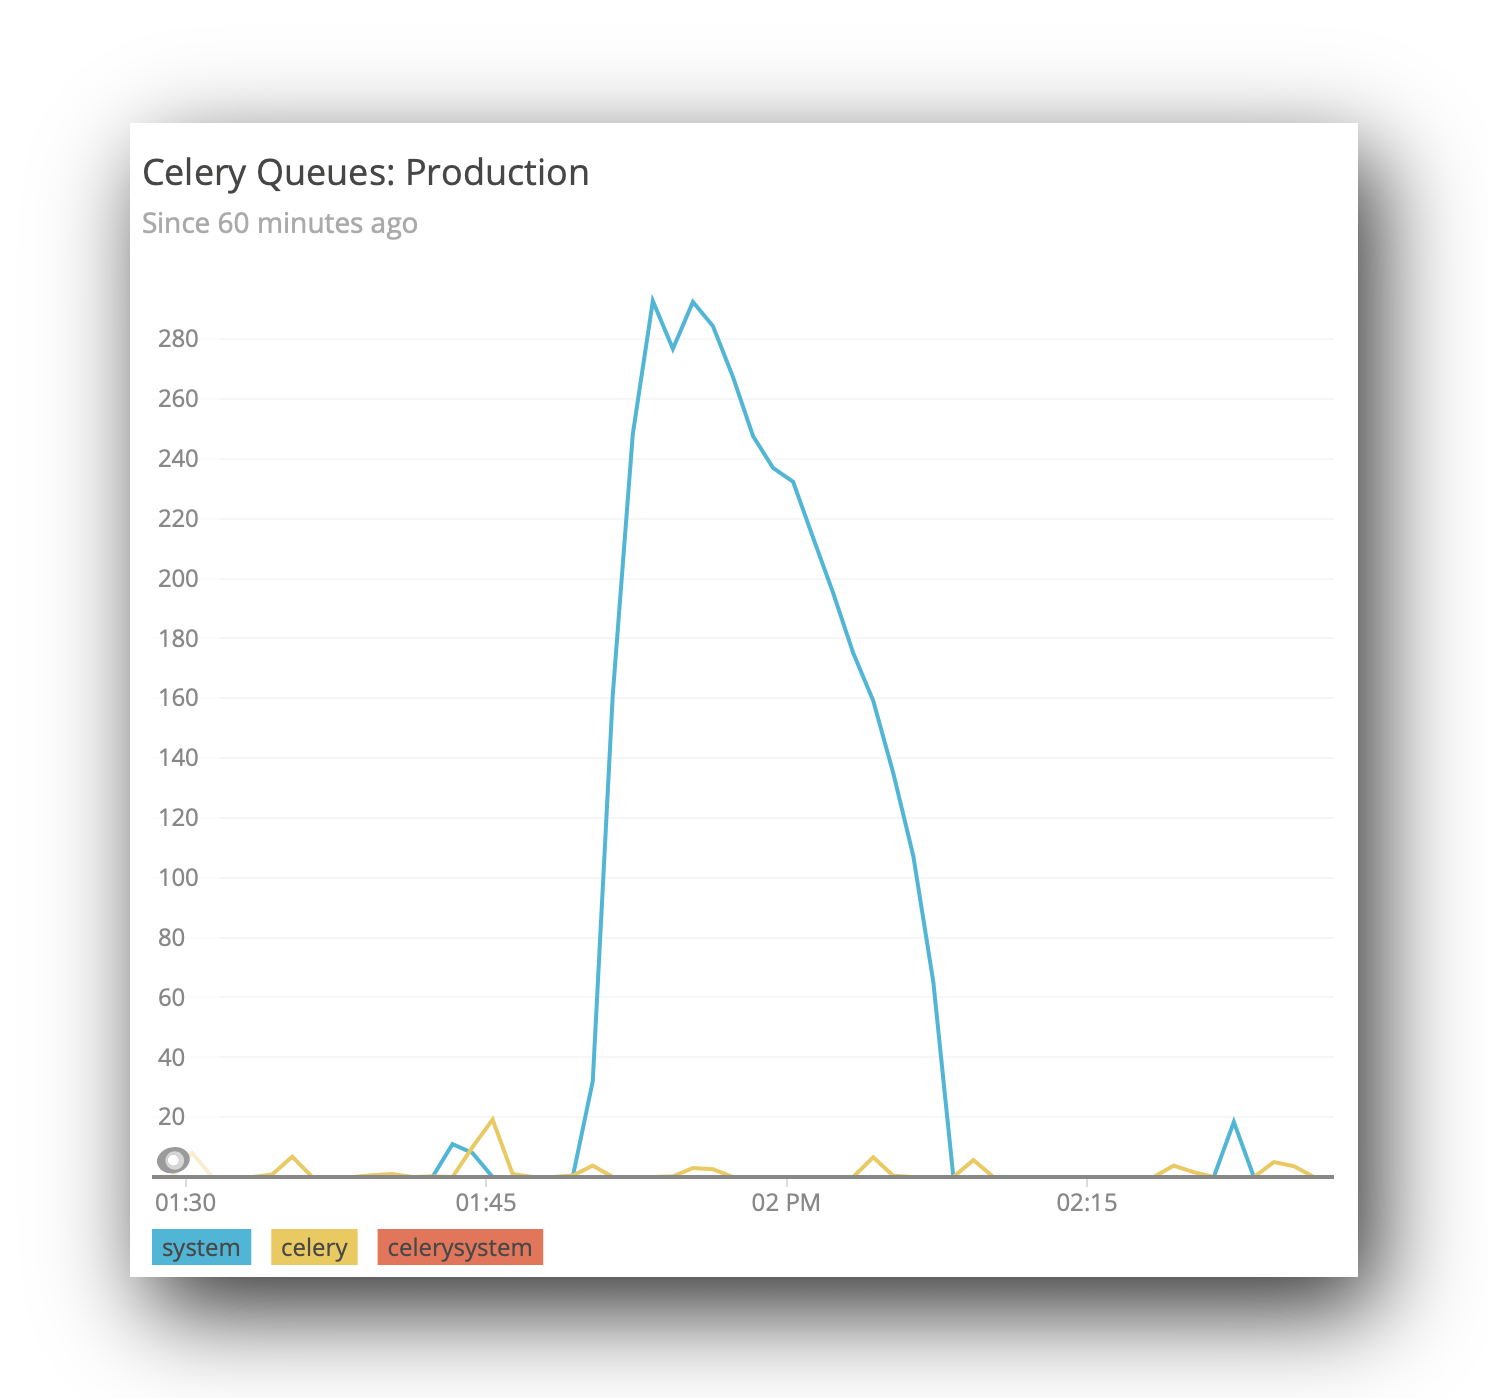
Logging Celery Queue Sizes in New Relic
-
Comments:
- here.
Several times during the last week, I needed to know the size of one of our celery queues. In one case, it was related to my battles with celery-once, in that I needed to see if tasks were being added. Usually, however, we need to know if we have a backlog of tasks.
Whilst looking, I wound up using the curses-based celery monitor, but this shows the tasks as they are added/processed. In practice, that was actually more useful for my celery once investigations, however the other use case (how much of a backlog we currently have) is an ongoing concern.
We use NewRelic for our performance monitoring, and I’ve yet to find anything that, out of the box, will act as plugin of some sort that pushes the queue lengths to a place in NewRelic that you can then view. I had toyed with the idea of just building our own dashboard specifically for this, but that means doing things like looking at values over time would require me to (a) store the queue sizes, and (b) write visualisation tools.
NewRelic has some tools for arbitrary metrics gathering (and visualisation), under it’s Insights package. We can leverage these to get nice monitoring, without having to write any UI code.
So, it turns out we can send a JSON object (or more than one) to a specific endpoint. The data that is in here is largely arbitrary, as long as it has an eventType, and possibly an appId. The former is used to say what type of event this datum is, and the latter is useful if you have different NewRelic applications (we do). For more detail, see the documentation.
[
  {
    "eventType": "CeleryQueueSize",
    "queue": "celery",
    "length": 22,
    "appId": 12345678
  }
]
All we need now is some mechanism to (a) collect those metrics from our celery backend, and (b) send it through to NewRelic.
In our case, we are using redis, so we can client.llen(queue_name). Because I run this command on our container that runs celerybeat, and does not have very many resources, I was not able to load all of django, so made a simpler version that is just pure python:
#! /bin/env python

import os
import time

import redis
import requests

ACCOUNT_ID = 111111   # Get this from your URL in NewRelic
URL = 'https://insights-collector.newrelic.com/v1/accounts/{}/events'.format(ACCOUNT_ID)
APP_ID = 123456789    # Get this from your URL in NewRelic too.
QUEUES = ['celery', 'system']  # We have two celery queues.
API_KEY = '37a1eaba-2b8c-4f37-823d-ba4bf4391f9b'  # You will need to generate one of these.

client = redis.Redis.from_url(os.environ['CACHE_URL'])
headers = {
    'X-Insert-Key': API_KEY,
}

def send():
    data = [
        {
            'eventType': 'CeleryQueueSize',
            'queue': queue_name,
            'length': client.llen(queue_name),
            'appId': APP_ID
        } for queue_name in QUEUES
    ]
    requests.post(URL, json=data, headers=headers)


if __name__ == '__main__':
    while True:
        send()
        time.sleep(10)
Now we can have this command started automatically when our system boots (but only in one container, although you could probably have it run in multiple containers).
You’ll probably want to configure a Dashboard in Insights, but you should be able to use the Data Explorer to view the data in an ad-hoc manner.
