Do I Need More Panels?
-
Comments:
- here.
Last time, I showed how it’s possible to do some analysis of different retailers and pricing, based on actual consumption and generation: or more specifically, actual feed-in and feed-out. But this is all stuff that is possible to do using a spreadsheet: indeed, until I finally got around to putting this into some nice SQL views, I was using a spreadsheet, and manually updating the values every day to keep it up to date. Whilst this was a fun thing to do every morning, it really was something I needed to automate. It is not necessary to have more than daily totals for the purposes of calculating costs: indeed all retailers use daily totals (or monthly averages) to determine the tariffs that need to apply.
But, if you want to examine your solar generation, and determine if you should have more (or fewer) panels, then you need more granular information.
In my specific case, I have panels that are covering around 1/5 of my roof space. My roof is almost flat, so I can fairly safely state that if I had twice as many panels (or 5 times as many panels), then I’d have generation that increases by that factor. I understand that this is not the case for many homes: anyone who has a highly raked roof, and especially someone who has to deal with an East-West split of panels is not going to be able to make the same assumptions.
However, even in the case of my flat roof, there’s complications. I only have single phase power, and SA Power Networks limits the export per-phase to 5kW. That’s the size of my inverter, so, if I was generating full power, and not using any, then it would appear at first glance to be not worth having any extra panels.
But there are two assumptions in that paragraph that almost never hold true. Firstly, there is almost always someone home at my house during the day, so we use a reasonable amount of energy. This is actually beneficial: we can have the dishwasher and washing machine (and sometimes even the oven) on during the day, and my Fronius Dashboard makes it easy to see if we are generating surplus. So this means we can make better use of the power we are generating, rather than running those appliances at night or when we are not generating enough energy.
The other one is about maximum generation. Whilst today when I looked, we were actually generating 5kW, for much of the year, we don’t get that close to that value at all, let alone for the full day. Especially during winter (when at times we do not even generate enough to supply our heating needs during the daylight hours). So, we could have more panels to generate more energy during winter, and also during summer, when we may find we run the Air Conditioner during the peak time.
However, with more than 5kW of generation, it is possible at times we would be generating more energy than we were using, and have a surplus of more than 5kW. This would mean we would only be able to export 5kW, and the rest would be wasted.
It would be interesting, though, to see what having twice as many panels did to our annual import/export amounts.
The process of calculating this requires us to know the generation and consumption values: for the purposes of these calculations, the import and export values are irrelevant: we will be calculating new values. It is possible to ask the inverter for generation values, and depending upon your local hardware, you can get the import and export values: from this we can calculate the consumption. Alternatively, you could get the import and export values from your retailer or supplier, and perform the same calculations based on your generation:
consumption = import + generation - export
Once we have that value for every interval, we can look at something that gives us “what if?” capacity.
CREATE OR REPLACE VIEW consumption AS
SELECT timestamp,
       import.energy + generation.energy - export.energy AS energy
  FROM generation
 INNER JOIN import USING (timestamp)
 INNER JOIN export USING (timestamp);
Since we do not care about shorter-than-daily intervals for the purposes of cost calculations, my function will return per-day values: specifically they will use the fact that postgres can define functions that return a set of values of a specific type; that type can even be the implicit type that is created for each table or view. I have a view called daily_summary, that looks like (including the summary view for reference):
CREATE OR REPLACE VIEW summary AS (
    SELECT timestamp,
           generation.energy AS generation,
           import.energy AS import,
           export.energy AS export,
           import.energy + generation.energy - export.energy AS consumption
      FROM generation
     INNER JOIN import USING (timestamp)
     INNER JOIN export USING (timestamp)
);

CREATE OR REPLACE VIEW daily_summary AS (
    SELECT timestamp::DATE AS date,
           SUM(generation) AS generation,
           SUM(import) AS import,
           SUM(export) AS export,
           SUM(consumption) AS consumption
      FROM summary
     GROUP BY timestamp::DATE
);
As such, I can write my function so it returns a set of daily_summary:
CREATE OR REPLACE FUNCTION panel_factor(FLOAT)
RETURNS SETOF daily_summary AS $$

WITH raw AS (
    SELECT timestamp,
           generation * $1 AS generation,
           consumption
      FROM summary
),
limited AS (
    SELECT timestamp::DATE AS date,
           generation,
           GREATEST(0, consumption - generation)::INTEGER AS import,
           CASE WHEN generation <= consumption THEN 0
                WHEN generation - consumption < 5000 / 12  THEN generation - consumption
                ELSE 5000 / 12 END::INTEGER AS export,
           consumption
      FROM raw
)
SELECT date, SUM(generation), SUM(import), SUM(export), SUM(consumption)
FROM limited
GROUP BY date
;

$$ LANGUAGE SQL;
This takes an argument that is a floating point value (I may want to increase my PV size by 50%, for instance), and multiplies the generation for each interval by this factor. It then works out what the import and export values would likely be for each interval. This is probably the least accurate part, because it’s possible that the initial data had both export and import during a given interval. However, I’ve ignored this, and just assumped that the generation and consumption for each interval are approximately stable.
Then we truncate our export to 5000 / 12, because my data is 5 minute intervals, so 5kW for an hour would be 5kWh, so 5kW for 5 minutes would be 5000 / 12 = 416.67kWh. This would necessarily change if you had different export limits, or a different time interval. Keep in mind that the larger the time interval, the less safe the assumption about consumption and generation stability across the period is.
From there, we add these values up for each day.
We can run this function and see what it does for our import/export amounts for some days. In my case, I can see that having 2x panels makes a fairly small difference during December, however having 2.5 times as many panels in June would mean I was exporting about as much as I would import: compared to last June when I imported almost 5x as much energy as I exported.
Interesting.
However, we can’t just look at import/export amounts: I only get paid 50% for a kWh I export compared to how much I import for, and then there are daily tariffs too. So, we want a function that compares costs: and to make it easier to look at, we will just use one that calculates costs over the whole period:
CREATE OR REPLACE FUNCTION compare(factor FLOAT)
RETURNS TABLE (name TEXT, cost INTEGER, difference INTEGER) AS $$

WITH old_costs AS (
    SELECT name,
           SUM(cost) AS cost
      FROM (
          SELECT retailer.name, cost(retailer, import::INTEGER, export::INTEGER)
            FROM daily_summary, retailer
      ) _
     GROUP BY name
), new_costs AS (
    SELECT name,
           SUM(cost) AS cost
      FROM (
          SELECT retailer.name, cost(retailer, import::INTEGER, export::INTEGER)
            FROM panel_factor(factor), retailer
      ) _
     GROUP BY name
)

SELECT name,
       new_costs.cost::INTEGER AS cost,
       (new_costs.cost - old_costs.cost)::INTEGER AS difference
  FROM old_costs INNER JOIN new_costs USING (name)


$$ LANGUAGE SQL STRICT;
And we can run this a few times with different values, to see what that does to our costs.
SELECT * FROM compare(2) ORDER BY cost;
| name | cost | difference |
|---|---|---|
| AGL Essentials | 210 | -688 |
| AGL Solar Savers | 234 | -763 |
| Origin Energy | 276 | -695 |
| AGL Residential Essentials | 302 | -615 |
| Click Banksia Solar | 303 | -726 |
| Lumo Basic | 323 | -643 |
| SA Simply RAA VPP | 334 | -645 |
| Power Direct Residential Saver | 427 | -554 |
| Energy Australia Total Plan Home | 437 | -664 |
| Powerband Home Flat + Solar FIT | 447 | -510 |
| Red Energy Living Energy Saver | 547 | -547 |
| PowerShop Shopper Market | 650 | -418 |
| Kogan | 702 | -377 |
| Alinta Energy No Fuss (Single Rate) | 714 | -466 |
| Origin Energy Econnex | 728 | -431 |
| Diamond Energy Everyday Renewable Saver | 732 | -573 |
| Blue NRG DMO - General Usage | 1476 | -460 |
Interesting: AGL is still cheapest. What about if we had 3x the panels:
| name | cost | difference |
|---|---|---|
| AGL Solar Savers | -120 | -1117 |
| AGL Essentials | -109 | -1007 |
| Origin Energy | -45 | -1017 |
| Click Banksia Solar | -33 | -1062 |
| AGL Residential Essentials | 18 | -899 |
| Lumo Basic | 26 | -940 |
| SA Simply RAA VPP | 36 | -944 |
| Energy Australia Total Plan Home | 132 | -970 |
| Power Direct Residential Saver | 173 | -808 |
| Powerband Home Flat + Solar FIT | 212 | -745 |
| Red Energy Living Energy Saver | 297 | -798 |
| PowerShop Shopper Market | 460 | -608 |
| Diamond Energy Everyday Renewable Saver | 472 | -834 |
| Alinta Energy No Fuss (Single Rate) | 503 | -677 |
| Kogan | 533 | -547 |
| Origin Energy Econnex | 534 | -625 |
| Blue NRG DMO - General Usage | 1277 | -659 |
Oh, AGL is still cheapest: however it’s now a different plan that wins out.
And if I had 5x the panels?
| name | cost | difference |
|---|---|---|
| AGL Solar Savers | -505 | -1502 |
| AGL Essentials | -457 | -1354 |
| Click Banksia Solar | -398 | -1427 |
| Origin Energy | -395 | -1366 |
| Lumo Basic | -297 | -1264 |
| AGL Residential Essentials | -290 | -1207 |
| SA Simply RAA VPP | -288 | -1268 |
| Energy Australia Total Plan Home | -199 | -1300 |
| Power Direct Residential Saver | -101 | -1082 |
| Powerband Home Flat + Solar FIT | -41 | -998 |
| Red Energy Living Energy Saver | 27 | -1067 |
| Diamond Energy Everyday Renewable Saver | 194 | -1112 |
| PowerShop Shopper Market | 258 | -810 |
| Alinta Energy No Fuss (Single Rate) | 279 | -901 |
| Origin Energy Econnex | 329 | -830 |
| Kogan | 353 | -727 |
| Blue NRG DMO - General Usage | 1074 | -862 |
Neat. Still AGL Solar Savers. That does have the highest feed-in tariff, so that makes sense.
Now, that gives me the amount I would save on that plan, but how much would it save me compared to my current plan? Well, that’s around $890 so far, so that’s about $2400.
So, we can aggregate this into a table showing us how much we would save by having different increases in panel amounts:
SELECT factor,
       MIN(cost) AS cost,
       890 - MIN(cost) AS saving
  FROM generate_series(1, 5, 0.5) factor, compare(factor)
 GROUP BY factor
 ORDER BY factor;
| factor | cost | saving |
|---|---|---|
| 1 | 890 | 0 |
| 1.5 | 474 | 416 |
| 2.0 | 210 | 680 |
| 2.5 | 28 | 862 |
| 3.0 | -120 | 1010 |
| 3.5 | -243 | 1133 |
| 4.0 | -345 | 1235 |
| 4.5 | -431 | 1321 |
| 5.0 | -505 | 1395 |
We can plot this:
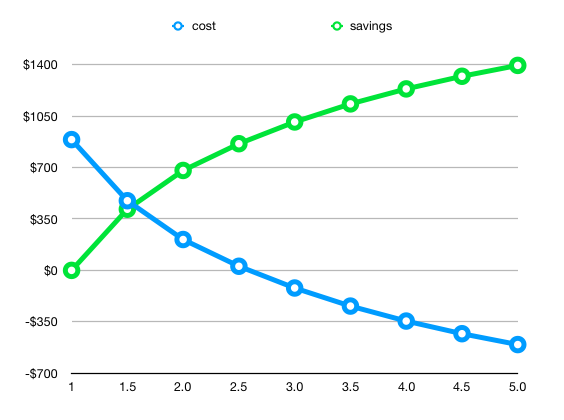
That certainly shows the diminishing returns!
But what about looking at how many years a given system of that size would take to pay off given this level of saving?
Using a fairly conservative value of $5000 for doubling my panel/inverter amount (6.6kW/5kW inverter), this gives me a payback table that looks something like:
| Panel factor | Payback years |
|---|---|
| 1.5 | 6 |
| 2.0 | 7 |
| 2.5 | 9 |
| 3.0 | 10 |
| 3.5 | 11 |
| 4.0 | 12 |
| 4.5 | 13 |
| 5.0 | 14 |
That is interesting. It is worth noting that this is based on costs since March, so it doesn’t take into account the peak solar generation time (summer) here in Australia. But it does mean that doubling my panels could take twice as long to pay back as I believe my initial investment is going to take.
So, should I get more panels?
Probably.
I’m going to wait until I have a full year of proper data, and then re-evaluate. I always planned to get more at some point - it seems to me that the over time FITs will begin to drop (I mean, they have already: I have a friend who is grandfathered in to a $0.40c FIT, but she can’t make her system larger without losing that tariff), and the prices of batteries will drop even further.
Having a battery added into the mix could reduce even further the import costs, but at an obvious reduction of export energy too: and the big concerns about batteries right now are that they are marginal in reducing power bills by enough to break even: their payback time currently exceeds their warranty period; and more worryingly, battery chemistry suggests their performance will degrade significantly over that period too.
Oh, and the other thing I can do is run a simulation of what my power bill would look like without any PV generation. Pretty much every retailer would have been well over $2000, which means I really have saved a bunch of money (even though, as already mentioned, I haven’t had the system for a whole summer). Perhaps the most interesting thing is that my power bills from last year were still several hundred dollars more than what these calculations show - that means that even having the panels means as a household we have been far more aware of how much power we are using (even during the day).