Heat Pump Hot Water

Heat pumps seem like magic. You use a certain amount of energy (let’s go with 1kWh), and you use this to extract heat from the ambient air, and this allows you to apply a multiple (let’s go with 3kWh) of your original energy input.

This is significantly better than an element heater: in that situation, you can only apply a smaller multiple, depending upon the efficiency of the element.

Similarly, burning gas to heat up water is less efficient - you don’t quite get to apply all of the energy from the amount of gas you burn to the water. I believe boilers and element heaters are around 85% efficient.

This is also how reverse cycle air conditioners work - basically a transfer fluid is used to extract the heat from the ambient air, and either push this cooled air, or use the energy extracted to heat up other air to push around.

But heat pumps, unlike a gas heater, can use renewable energy as the source of heating water. This interests me greatly.

Currently, I spend around $100/month on gas - most of this is probably on my gas hot water, as a gas stove would use a small fraction. For my calculations, I went with 80% hot water, 20% stove. This would not reduce my gas bill to $20/month though, because of daily tariffs (the bane of low-consumption systems). Instead, an 80% reduction in usage would drop my bills to between $35 and $40 per month. Indeed, it would save me almost exactly $2/day.

But the other factor to take into account is how much more of my solar generation I would be using to run the heat pump. To do this, I increased my consumption measurements from my previous calculations by 4kWh (800W for 5 hours, picking the peak solar generation time).

This resulted in a projected increase in my power bill of about $1.10 per day.

So, having a heat pump would probably save me less than $1 per day.

With a $4200 installation price (including STC credits), this looks like a payback time in excess of 12 years. Which is far larger than the warranty period of the system - this is looking marginal.

If I double my PV system size, and install a heat pump, this should result in my energy costs reducing by around $3.40 per day. This is about $1240 annually, but then there are two capital costs to cover: closer to $10k. This reduces the payback to around 8 years.

Interestingly, this is better than the payback of me just adding more solar panels - I used a cost of $6000 for the PV upgrade, and $4000 for the Heat Pump here, rather than the $5k I used in a previous blog post.

But probably still not good enough, right now.

Arlec Powerboard esphome

I bought one of the Grid Connect powerboards from Bunnings last week, and flashed it with a custom firmware.

The model I bought was the PB89HA, which is the one with 5 sockets (one of which is not switchable).

The button is on GPIO3, and the LED is an inverted GPIO1.

The four relays are on GPIO5, GPIO4, GPIO13 and GPIO12, starting with the one closest to the button.

Since there is only one button, and four switchable outlets, I had to come up with a mechanism for controlling all of them. I ended up (after playing around with single-through-quadruple click) with a single click for toggling the first relay (nearest the button). Then, a medium (between 1 and 2 second) press turns all relays off, and a long (greater than 2 second) press turns them all on.

This is not really ideal, as there is no way to toggle just relay 2-4 without using some sort of external control - which goes against my ethos with respect to smart home.

Having said that, I’m not actually sure how I’m going to use this board…I don’t really have a bunch of things that are potentially close together that need individual control. I guess I could have it turn off everything in the entertainment unit except the PVR - that might be a way to save power overnight. I’d want the button more accessible than the powerboard that currently controls them though.

Anyway, the base YAML file follows - be aware that this does not include wifi, and would need to be included in an actual config file (with a device name defined).

esphome:
  name: $device_name
  platform: ESP8266
  board: esp01_1m
  on_boot:
    - light.turn_on:
        id: led
        brightness: 20%

binary_sensor:
  - platform: status
    name: "Status"

  - platform: gpio
    pin:
      number: GPIO3
      inverted: true
      mode: INPUT_PULLUP
    name: button
    on_multi_click:
      - timing:
        - ON for at least 1s
        - OFF for at least 0.2s
        then:
          - switch.turn_off: relay_0
          - switch.turn_off: relay_1
          - switch.turn_off: relay_2
          - switch.turn_off: relay_3

      - timing:
        - ON for at least 2s
        - OFF for at least 0.2s
        then:
          - switch.turn_on: relay_0
          - switch.turn_on: relay_1
          - switch.turn_on: relay_2
          - switch.turn_on: relay_3

      - timing:
        - ON for at most 0.5s
        - OFF for at least 0.2s
        then:
          - switch.toggle: relay_0

switch:
  - platform: gpio
    id: relay_0
    pin: GPIO5
    on_turn_on:
      - mqtt.publish:
          topic: HomeKit/${device_name}/Outlet/0/On
          retain: ON
          payload: 1
    on_turn_off:
      - mqtt.publish:
         topic: HomeKit/${device_name}/Outlet/0/On
         retain: ON
         payload: 0

  - platform: gpio
    id: relay_1
    pin: GPIO4
    on_turn_on:
      - mqtt.publish:
          topic: HomeKit/${device_name}/Outlet/1/On
          retain: ON
          payload: 1
    on_turn_off:
      - mqtt.publish:
         topic: HomeKit/${device_name}/Outlet/1/On
         retain: ON
         payload: 0

  - platform: gpio
    id: relay_2
    pin: GPIO13
    on_turn_on:
      - mqtt.publish:
          topic: HomeKit/${device_name}/Outlet/2/On
          retain: ON
          payload: 1
    on_turn_off:
      - mqtt.publish:
         topic: HomeKit/${device_name}/Outlet/2/On
         retain: ON
         payload: 0

  - platform: gpio
    id: relay_3
    pin: GPIO12
    on_turn_on:
      - mqtt.publish:
          topic: HomeKit/${device_name}/Outlet/3/On
          retain: ON
          payload: 1
    on_turn_off:
      - mqtt.publish:
         topic: HomeKit/${device_name}/Outlet/3/On
         retain: ON
         payload: 0

light:
  - platform: monochromatic
    output: led1
    id: led
    restore_mode: ALWAYS_ON

output:
  - platform: esp8266_pwm
    pin:
      number: GPIO1
    id: led1
    inverted: True

sensor:
  - platform: wifi_signal
    name: "WiFi signal sensor"
    update_interval: 5min

ota:

logger:

mqtt:
  broker: "mqtt.lan"
  discovery: false
  topic_prefix: esphome/${device_name}
  on_message:
    - topic: HomeKit/${device_name}/Outlet/0/On
      payload: "1"
      then:
        - switch.turn_on:
            id: relay_0
    - topic: HomeKit/${device_name}/Outlet/0/On
      payload: "0"
      then:
        - switch.turn_off:
            id: relay_0

    - topic: HomeKit/${device_name}/Outlet/1/On
      payload: "1"
      then:
        - switch.turn_on:
            id: relay_1
    - topic: HomeKit/${device_name}/Outlet/1/On
      payload: "0"
      then:
        - switch.turn_off:
            id: relay_1

    - topic: HomeKit/${device_name}/Outlet/2/On
      payload: "1"
      then:
        - switch.turn_on:
            id: relay_2
    - topic: HomeKit/${device_name}/Outlet/2/On
      payload: "0"
      then:
        - switch.turn_off:
            id: relay_2

    - topic: HomeKit/${device_name}/Outlet/3/On
      payload: "1"
      then:
        - switch.turn_on:
            id: relay_3
    - topic: HomeKit/${device_name}/Outlet/3/On
      payload: "0"
      then:
        - switch.turn_off:
            id: relay_3

Fronius Dashboard 0.3.0

I released a new docker version of Fronius Dashboard a few days ago. It now allows you to specify your inverter power (in Watts), using an environment variable. The default value is 5000.

docker stop fronius-dashboard

docker rm fronius-dashboard

docker pull schinckel/fronius-dashboard

docker run \
  --publish 4000:4000 \
  --detach \
  --restart always \
  --name fronius-dashboard \
  --env INVERTER=<ip-address-or-hostname> \
  --env INVERTER_SIZE=<inverter-size-in-watts> \
  schinckel/fronius-dashboard:latest

If your inverter is 5kW, then you don’t need to apply this update.

DNS Redirection and badly behaved clients

A little while ago I repurposed a spare Raspberry Pi Zero (the one without WiFi), plugging it directly into my router, and setting it up as a pi hole DNS server.

I also changed the firewall rules in my network so that clients may only send DNS requests to that IP address (and it may then send DNS requests to whomever it chooses). And this is fine.

In fact, I didn’t really stop other devices sending DNS requests elsewhere, I just make it that any other devices that actually send out a DNS request have those packets forwarded to the pi hole. Which is even better.

Except: DNS responses also appear to indicate the server that fulfilled the request. Depending upon the client, this will either have no side effect, be logged as a strangeness, or fail.

I’ve only had a couple of devices that apparently have a hard-coded DNS server in their firmware, and to be honest, I’m not really that fussed about those devices. That hasn’t caused an issue for our day-to-day use.

However, during some tweaking (I was trying to get the local IPv6 DNS server to be set correctly by the DHCP setup), I managed to make it so it was no longer setting the pi hole as the DNS server. And for most devices, this was still fine. They may have logged extra errors about the incorrect server returning results, but everything was good.

Or so I thought.

See, some devices still had their old DHCP lease, and it was only when this expired and was renewed that they began to pick up incorrect DNS settings.

So that was how, at about 10 AM today, my inverter stopped uploading data to PVOutput.

Of course, I only figured out many hours later that this was the cause.

I could see that it was still making the DNS request (and the pi hole was responding), but the “Push Service” configurations were all reporting errors uploading. But the connection to Solar.Web was fine: and I was able to use my Fronius Dashboard, so I knew there was nothing wrong with the WiFi connection.

It turns out that the IP address for the Solar.Web upload must be hard-coded, because that was never being asked for by the inverter. And it was following the third path of DNS response from a different server: fail.

To be fair, one could argue this is the correct behaviour: it could prevent DNS poisoning - although, surely a nefarious DNS server would just respond with whatever IP address it saw was in the incoming packets.

Anyway, after trying a bunch of things (restarting the DataManager, and playing around with network configuration), I managed to get uploads working again, and figured out why the DNS setting was not being propogated.

Do I Need More Panels?

Last time, I showed how it’s possible to do some analysis of different retailers and pricing, based on actual consumption and generation: or more specifically, actual feed-in and feed-out. But this is all stuff that is possible to do using a spreadsheet: indeed, until I finally got around to putting this into some nice SQL views, I was using a spreadsheet, and manually updating the values every day to keep it up to date. Whilst this was a fun thing to do every morning, it really was something I needed to automate. It is not necessary to have more than daily totals for the purposes of calculating costs: indeed all retailers use daily totals (or monthly averages) to determine the tariffs that need to apply.

But, if you want to examine your solar generation, and determine if you should have more (or fewer) panels, then you need more granular information.

In my specific case, I have panels that are covering around 1/5 of my roof space. My roof is almost flat, so I can fairly safely state that if I had twice as many panels (or 5 times as many panels), then I’d have generation that increases by that factor. I understand that this is not the case for many homes: anyone who has a highly raked roof, and especially someone who has to deal with an East-West split of panels is not going to be able to make the same assumptions.

However, even in the case of my flat roof, there’s complications. I only have single phase power, and SA Power Networks limits the export per-phase to 5kW. That’s the size of my inverter, so, if I was generating full power, and not using any, then it would appear at first glance to be not worth having any extra panels.

But there are two assumptions in that paragraph that almost never hold true. Firstly, there is almost always someone home at my house during the day, so we use a reasonable amount of energy. This is actually beneficial: we can have the dishwasher and washing machine (and sometimes even the oven) on during the day, and my Fronius Dashboard makes it easy to see if we are generating surplus. So this means we can make better use of the power we are generating, rather than running those appliances at night or when we are not generating enough energy.

The other one is about maximum generation. Whilst today when I looked, we were actually generating 5kW, for much of the year, we don’t get that close to that value at all, let alone for the full day. Especially during winter (when at times we do not even generate enough to supply our heating needs during the daylight hours). So, we could have more panels to generate more energy during winter, and also during summer, when we may find we run the Air Conditioner during the peak time.

However, with more than 5kW of generation, it is possible at times we would be generating more energy than we were using, and have a surplus of more than 5kW. This would mean we would only be able to export 5kW, and the rest would be wasted.

It would be interesting, though, to see what having twice as many panels did to our annual import/export amounts.

The process of calculating this requires us to know the generation and consumption values: for the purposes of these calculations, the import and export values are irrelevant: we will be calculating new values. It is possible to ask the inverter for generation values, and depending upon your local hardware, you can get the import and export values: from this we can calculate the consumption. Alternatively, you could get the import and export values from your retailer or supplier, and perform the same calculations based on your generation:

consumption = import + generation - export

Once we have that value for every interval, we can look at something that gives us “what if?” capacity.

CREATE OR REPLACE VIEW consumption AS
SELECT timestamp,
       import.energy + generation.energy - export.energy AS energy
  FROM generation
 INNER JOIN import USING (timestamp)
 INNER JOIN export USING (timestamp);

Since we do not care about shorter-than-daily intervals for the purposes of cost calculations, my function will return per-day values: specifically they will use the fact that postgres can define functions that return a set of values of a specific type; that type can even be the implicit type that is created for each table or view. I have a view called daily_summary, that looks like (including the summary view for reference):

CREATE OR REPLACE VIEW summary AS (
    SELECT timestamp,
           generation.energy AS generation,
           import.energy AS import,
           export.energy AS export,
           import.energy + generation.energy - export.energy AS consumption
      FROM generation
     INNER JOIN import USING (timestamp)
     INNER JOIN export USING (timestamp)
);

CREATE OR REPLACE VIEW daily_summary AS (
    SELECT timestamp::DATE AS date,
           SUM(generation) AS generation,
           SUM(import) AS import,
           SUM(export) AS export,
           SUM(consumption) AS consumption
      FROM summary
     GROUP BY timestamp::DATE
);

As such, I can write my function so it returns a set of daily_summary:

CREATE OR REPLACE FUNCTION panel_factor(FLOAT)
RETURNS SETOF daily_summary AS $$

WITH raw AS (
    SELECT timestamp,
           generation * $1 AS generation,
           consumption
      FROM summary
),
limited AS (
    SELECT timestamp::DATE AS date,
           generation,
           GREATEST(0, consumption - generation)::INTEGER AS import,
           CASE WHEN generation <= consumption THEN 0
                WHEN generation - consumption < 5000 / 12  THEN generation - consumption
                ELSE 5000 / 12 END::INTEGER AS export,
           consumption
      FROM raw
)
SELECT date, SUM(generation), SUM(import), SUM(export), SUM(consumption)
FROM limited
GROUP BY date
;

$$ LANGUAGE SQL;

This takes an argument that is a floating point value (I may want to increase my PV size by 50%, for instance), and multiplies the generation for each interval by this factor. It then works out what the import and export values would likely be for each interval. This is probably the least accurate part, because it’s possible that the initial data had both export and import during a given interval. However, I’ve ignored this, and just assumped that the generation and consumption for each interval are approximately stable.

Then we truncate our export to 5000 / 12, because my data is 5 minute intervals, so 5kW for an hour would be 5kWh, so 5kW for 5 minutes would be 5000 / 12 = 416.67kWh. This would necessarily change if you had different export limits, or a different time interval. Keep in mind that the larger the time interval, the less safe the assumption about consumption and generation stability across the period is.

From there, we add these values up for each day.

We can run this function and see what it does for our import/export amounts for some days. In my case, I can see that having 2x panels makes a fairly small difference during December, however having 2.5 times as many panels in June would mean I was exporting about as much as I would import: compared to last June when I imported almost 5x as much energy as I exported.

Interesting.

However, we can’t just look at import/export amounts: I only get paid 50% for a kWh I export compared to how much I import for, and then there are daily tariffs too. So, we want a function that compares costs: and to make it easier to look at, we will just use one that calculates costs over the whole period:

CREATE OR REPLACE FUNCTION compare(factor FLOAT)
RETURNS TABLE (name TEXT, cost INTEGER, difference INTEGER) AS $$

WITH old_costs AS (
    SELECT name,
           SUM(cost) AS cost
      FROM (
          SELECT retailer.name, cost(retailer, import::INTEGER, export::INTEGER)
            FROM daily_summary, retailer
      ) _
     GROUP BY name
), new_costs AS (
    SELECT name,
           SUM(cost) AS cost
      FROM (
          SELECT retailer.name, cost(retailer, import::INTEGER, export::INTEGER)
            FROM panel_factor(factor), retailer
      ) _
     GROUP BY name
)

SELECT name,
       new_costs.cost::INTEGER AS cost,
       (new_costs.cost - old_costs.cost)::INTEGER AS difference
  FROM old_costs INNER JOIN new_costs USING (name)


$$ LANGUAGE SQL STRICT;

And we can run this a few times with different values, to see what that does to our costs.

SELECT * FROM compare(2) ORDER BY cost;
name cost difference
AGL Essentials 210 -688
AGL Solar Savers 234 -763
Origin Energy 276 -695
AGL Residential Essentials 302 -615
Click Banksia Solar 303 -726
Lumo Basic 323 -643
SA Simply RAA VPP 334 -645
Power Direct Residential Saver 427 -554
Energy Australia Total Plan Home 437 -664
Powerband Home Flat + Solar FIT 447 -510
Red Energy Living Energy Saver 547 -547
PowerShop Shopper Market 650 -418
Kogan 702 -377
Alinta Energy No Fuss (Single Rate) 714 -466
Origin Energy Econnex 728 -431
Diamond Energy Everyday Renewable Saver 732 -573
Blue NRG DMO - General Usage 1476 -460

Interesting: AGL is still cheapest. What about if we had 3x the panels:

name cost difference
AGL Solar Savers -120 -1117
AGL Essentials -109 -1007
Origin Energy -45 -1017
Click Banksia Solar -33 -1062
AGL Residential Essentials 18 -899
Lumo Basic 26 -940
SA Simply RAA VPP 36 -944
Energy Australia Total Plan Home 132 -970
Power Direct Residential Saver 173 -808
Powerband Home Flat + Solar FIT 212 -745
Red Energy Living Energy Saver 297 -798
PowerShop Shopper Market 460 -608
Diamond Energy Everyday Renewable Saver 472 -834
Alinta Energy No Fuss (Single Rate) 503 -677
Kogan 533 -547
Origin Energy Econnex 534 -625
Blue NRG DMO - General Usage 1277 -659

Oh, AGL is still cheapest: however it’s now a different plan that wins out.

And if I had 5x the panels?

name cost difference
AGL Solar Savers -505 -1502
AGL Essentials -457 -1354
Click Banksia Solar -398 -1427
Origin Energy -395 -1366
Lumo Basic -297 -1264
AGL Residential Essentials -290 -1207
SA Simply RAA VPP -288 -1268
Energy Australia Total Plan Home -199 -1300
Power Direct Residential Saver -101 -1082
Powerband Home Flat + Solar FIT -41 -998
Red Energy Living Energy Saver 27 -1067
Diamond Energy Everyday Renewable Saver 194 -1112
PowerShop Shopper Market 258 -810
Alinta Energy No Fuss (Single Rate) 279 -901
Origin Energy Econnex 329 -830
Kogan 353 -727
Blue NRG DMO - General Usage 1074 -862

Neat. Still AGL Solar Savers. That does have the highest feed-in tariff, so that makes sense.

Now, that gives me the amount I would save on that plan, but how much would it save me compared to my current plan? Well, that’s around $890 so far, so that’s about $2400.

So, we can aggregate this into a table showing us how much we would save by having different increases in panel amounts:

SELECT factor,
       MIN(cost) AS cost,
       890 - MIN(cost) AS saving
  FROM generate_series(1, 5, 0.5) factor, compare(factor)
 GROUP BY factor
 ORDER BY factor;
factor cost saving
1 890 0
1.5 474 416
2.0 210 680
2.5 28 862
3.0 -120 1010
3.5 -243 1133
4.0 -345 1235
4.5 -431 1321
5.0 -505 1395

We can plot this:

cost-savings

That certainly shows the diminishing returns!

But what about looking at how many years a given system of that size would take to pay off given this level of saving?

Using a fairly conservative value of $5000 for doubling my panel/inverter amount (6.6kW/5kW inverter), this gives me a payback table that looks something like:

Panel factorPayback years
1.56
2.07
2.59
3.010
3.511
4.012
4.513
5.014

That is interesting. It is worth noting that this is based on costs since March, so it doesn’t take into account the peak solar generation time (summer) here in Australia. But it does mean that doubling my panels could take twice as long to pay back as I believe my initial investment is going to take.


So, should I get more panels?

Probably.

I’m going to wait until I have a full year of proper data, and then re-evaluate. I always planned to get more at some point - it seems to me that the over time FITs will begin to drop (I mean, they have already: I have a friend who is grandfathered in to a $0.40c FIT, but she can’t make her system larger without losing that tariff), and the prices of batteries will drop even further.

Having a battery added into the mix could reduce even further the import costs, but at an obvious reduction of export energy too: and the big concerns about batteries right now are that they are marginal in reducing power bills by enough to break even: their payback time currently exceeds their warranty period; and more worryingly, battery chemistry suggests their performance will degrade significantly over that period too.


Oh, and the other thing I can do is run a simulation of what my power bill would look like without any PV generation. Pretty much every retailer would have been well over $2000, which means I really have saved a bunch of money (even though, as already mentioned, I haven’t had the system for a whole summer). Perhaps the most interesting thing is that my power bills from last year were still several hundred dollars more than what these calculations show - that means that even having the panels means as a household we have been far more aware of how much power we are using (even during the day).

PV Solar panel analysis in postgres

Australian (and especially South Australian) electricity is expensive. That is probably part of the reason that SA is leading the world in residential rooftop solar.

But it is hard to negotiate the electricity retail market. Knowing your daily usage and feed-in enables you to determine which retailer you should choose, but only if you have the tools available to you to compare what your costs would have been with each retail plan.

And this does not even begin to address the question of if it is cost-effective to increase the size of your PV generation system: most supply companies (who, as it turns out, are different entities to the retailers) have per-phase limits of 5kW: that is, you may never feed back into the grid more than 5kW at any point in time.

Since I had my Fronius Smart Meter installed, I have been able to run reports and get my daily import and export values: these are also available through my retailer, and even through SA Power Networks, the distributor.

I have my data stored in three tables:

REATE TABLE generation (
  "timestamp" TIMESTAMP UNIQUE PRIMARY KEY,
  "energy" FLOAT
);

CREATE TABLE import_cumulative (
  "timestamp" TIMESTAMP UNIQUE PRIMARY KEY,
  "energy" INTEGER
);

CREATE TABLE export_cumulative (
  "timestamp" TIMESTAMP UNIQUE PRIMARY KEY,
  "energy" INTEGER
);

This is really only necessary because I need to take the cumulative values in the import and export tables, and turn them into absolute values for that period:

CREATE OR REPLACE VIEW import AS (
  SELECT timestamp,
         energy - LAG(energy, 1) OVER (ORDER BY timestamp) AS energy
    FROM import_cumulative
   ORDER BY timestamp
);

CREATE OR REPLACE VIEW export AS (
  SELECT timestamp,
         energy - LAG(energy, 1) OVER (ORDER BY timestamp) AS energy
    FROM export_cumulative
   ORDER BY timestamp
);

Now, from these views, it is possible to do some modelling of what different retailers would cost, but they generally need stuff per-day, so we can create a view that combines them. Since I will be doing stuff later that also needs consumption and generation, I will also include them:

CREATE OR REPLACE VIEW consumption AS
SELECT timestamp, 
       import.energy + generation.energy - export.energy AS energy
  FROM generation
 INNER JOIN import USING (timestamp)
 INNER JOIN export USING (timestamp);

And our summary (for each interval):

CREATE OR REPLACE VIEW summary AS (
    SELECT timestamp,
           generation.energy AS generation,
           import.energy AS import,
           export.energy AS export,
           import.energy + generation.energy - export.energy AS consumption
      FROM generation
     INNER JOIN import USING (timestamp)
     INNER JOIN export USING (timestamp)    
);

Getting close to having some usable data there now. What about daily summaries?

CREATE OR REPLACE VIEW daily_summary AS (
    SELECT timestamp::DATE AS date,
           SUM(generation) AS generation,
           SUM(import) AS import,
           SUM(export) AS export,
           SUM(consumption) AS consumption
      FROM summary
     GROUP BY timestamp::DATE
);

That gives us per-day summaries of our generation, import and export.

Here are some values from my system:

SELECT * FROM daily_summary LIMIT 10;
date generation import export consumption
2019-03-07 29851.915 7587 24191 13247.915
2019-03-08 14033.2047222222 7578 9156 12455.2047222222
2019-03-09 28074.8316666667 5746 20961 12859.8316666667
2019-03-10 15239.6936111111 7669 9144 13764.6936111111
2019-03-11 21101.1441666667 6528 12657 14972.1441666667
2019-03-12 28231.4280555556 5955 22382 11804.4280555556
2019-03-13 22880.3077777778 6040 17411 11509.3077777778
2019-03-14 30440.8319444444 6658 24791 12307.8319444444
2019-03-15 30141.3888888889 6576 26227 10490.3888888889
2019-03-16 29286.4413888889 7336 22224 14398.4413888889

(10 rows)

Right. So now we want to be able to look at costs for different retailers. There is a magnificent resource for getting this data: Energy Made Easy. The rates differ for different postcodes (WAT): I’m not sure if they are the same across a whole state or not. Probably not.

Anyway, it turns out that there are some retailers who have three different rates, depending upon your usage during a day. It’s not clear to me if this value is averaged across the whole month when you are on a smart meter: I know it is when you are on one of the old spinning disk meters. I assume it would be calculated on each day, as I think that works out as more expensive for the customer. Diamond Energy appears to have per-month limits, and four different rates, so I just pro-rated them to a 30 day month. I did not bother modelling the fourth rate, as I established fairly early on that they are not going to be close to being the cheapest. I may implement that later, just for completeness.

So, to be able to calculate costs for all retailers, we need to store up to three rates, and the two kWh thresholds that trigger those limits. Note that the second

CREATE TABLE retailer (
    name TEXT PRIMARY KEY,
    supply_charge NUMERIC NOT NULL,
    kWh_rate_1 NUMERIC NOT NULL,
    kWh_limit_1 NUMERIC,
    kWh_rate_2 NUMERIC,
    kWh_limit_2 NUMERIC,
    kWh_rate_3 NUMERIC,
    pay_on_time_discount NUMERIC,
    feed_in_tariff NUMERIC NOT NULL
);

ALTER TABLE retailer 
    ADD CONSTRAINT rate_2_requires_limit_1 
        CHECK (kWh_rate_2 IS NULL OR kWh_limit_1 IS NOT NULL),
    ADD CONSTRAINT rate_3_requires_limit_2 
        CHECK (kWh_rate_3 IS NULL OR kWh_limit_2 IS NOT NULL),
    ADD CONSTRAINT rate_3_requires_rate_2 
        CHECK (kWh_rate_3 IS NULL OR kWh_rate_2 IS NOT NULL);

The three check constraints just ensure that we do not accidentally insert a rate where there is no lower tier rate, or no limit in place to apply it from.

Here is a query that inserts values for the retailers for my postcode:

INSERT INTO retailer (
  name, supply_charge, 
  kWh_rate_1, kWh_limit_1, 
  kWh_rate_2, kWh_limit_2, 
  kWh_rate_3, 
  feed_in_tariff, 
  pay_on_time_discount)
VALUES 
  ('AGL Essentials', 0.8855, 0.3575, NULL, NULL, NULL, NULL, 0.1630, NULL),
  ('Origin Energy', 0.9033, 0.4002, 4, 0.4272, NULL, NULL, 0.1800, 0.10),
  ('AGL Solar Savers', 0.8910, 0.4038, NULL, NULL, NULL, NULL, 0.1800, NULL),
  ('Click Banksia Solar', 0.9966, 0.3941, NULL, NULL, NULL, NULL, 0.1700, NULL),
  ('Power Direct Residential Saver', 0.8910, 0.4038, NULL, NULL, NULL, NULL, 0.1420, 0.13),
  ('SA Simply RAA VPP', 0.9863, 0.3600, NULL, NULL, NULL, NULL, 0.1500, NULL),
  ('Kogan', 0.9566, 0.3154, NULL, NULL, NULL, NULL, 0.0748, NULL),
  ('PowerShop Shopper Market', 1.1912, 0.3760, NULL, NULL, NULL, NULL, 0.1020, 0.15),
  ('AGL Residential Essentials', 0.7752, 0.3512, NULL, NULL, NULL, NULL, 0.1420, NULL),
  ('Diamond Energy Everyday Renewable Saver', 0.9565, 0.3659, 3.33, 0.3948, 11.1, 0.4285, 0.12, NULL),
  ('Red Energy Living Energy Saver', 0.9790, 0.3641, NULL, NULL, NULL, NULL, 0.1200, NULL),
  ('Blue NRG DMO - General Usage', 0.7810, 0.3736, 10.96, 0.5775, NULL, NULL, 0.0680, NULL),
  ('Energy Australia Total Plan Home', 0.8580, 0.4070, NULL, NULL, NULL, NULL, 0.15, NULL),
  ('Alinta Energy No Fuss (Single Rate)', 0.9130, 0.3317, 3.29, 0.3695, NULL, NULL, 0.0950, NULL),
  ('Lumo Basic', 1.0120, 0.3539, NULL, NULL, NULL, NULL, 0.15, NULL),
  ('Powerband Home Flat + Solar FIT', 1.0322, 0.3066, 10.95, 0.3139, NULL, NULL, 0.1150, NULL),
  ('Origin Energy Econnex', 0.9081, 0.4024, 10.96, 0.4294, NULL, NULL, 0.1000, 0.15)
  ON CONFLICT DO NOTHING
;

To calculate the cost for a day, we need to add the daily supply charge, and the amount of import that applies at each rate multiplied by that rate, minus the FIT (feed-in tariff) for the export amount. Because some retailers have a “pay on time discount” (which is really just a late-payment penalty, but that is another blog post waiting to happen), it’s important to note that this discount applies to the whole bill - meaning it needs to be applied after the feed-in tariff has been subtracted.

Here is a function that calculates a daily cost, given a retailer record and import and export values:

CREATE OR REPLACE FUNCTION cost(retailer RETAILER, import INTEGER, export INTEGER)
RETURNS NUMERIC AS $$

SELECT COALESCE(1 - retailer.pay_on_time_discount, 1.0) * (retailer.supply_charge +
       -- rate 3
       CASE WHEN retailer.kWh_limit_2 IS NULL THEN 0
            WHEN import <= retailer.kWh_limit_2 THEN 0
            ELSE import - retailer.kWh_limit_2
       END / 1000.0 * COALESCE(retailer.kWh_rate_3, 0) +
       -- rate 2: hours between limit 1 and limit 2
       CASE WHEN retailer.kWh_limit_1 IS NULL THEN 0
            WHEN retailer.kWh_limit_2 IS NULL THEN GREATEST(import - retailer.kWh_limit_1, 0)
            WHEN import < retailer.kWh_limit_1 THEN 0
            ELSE LEAST(import, retailer.kWh_limit_2) - retailer.kWh_limit_1
       END / 1000.0 * COALESCE(retailer.kWh_rate_2, 0) +
       -- rate 1: up to limit 1
       CASE WHEN retailer.kWh_limit_1 IS NULL THEN import
            ELSE LEAST(import, retailer.kWh_limit_1)
       END / 1000.0 * retailer.kWh_rate_1 -
       retailer.feed_in_tariff * export / 1000.0);

$$ LANGUAGE SQL STRICT;

It is a little hard to follow, and if the daily amount was negative, it decreases that value (instead of ignoring the discount), but it will do for now. I would prefer not to choose a retailer that hides a penalty behind a so-called discount anyway, so they would have to be significantly cheaper to attract my custom.

Using this function, we can now calculate the total costs for all retailers, and compare them:

SELECT retailer.name,
       '$ ' || lpad(
         TRUNC(SUM(cost(retailer, import::INTEGER, export::INTEGER)), 2)::TEXT,
         9
       ) AS cost
  FROM daily_summary, retailer
 GROUP BY retailer.name
 ORDER BY cost ASC;

There is a bunch of code in there to make the output prettier: some of that is lost by the HTML output I have used to generate this table. In an SQL view, those decimal points would all line up…

name cost
AGL Essentials $ 897.87
AGL Residential Essentials $ 916.85
Powerband Home Flat + Solar FIT $ 955.59
Lumo Basic $ 965.56
Origin Energy $ 971.44
SA Simply RAA VPP $ 978.81
Power Direct Residential Saver $ 979.84
AGL Solar Savers $ 997.31
Click Banksia Solar $ 1028.43
PowerShop Shopper Market $ 1065.24
Kogan $ 1075.74
Red Energy Living Energy Saver $ 1092.32
Energy Australia Total Plan Home $ 1100.55
Origin Energy Econnex $ 1155.60
Alinta Energy No Fuss (Single Rate) $ 1176.65
Diamond Energy Everyday Renewable Saver $ 1302.24
Blue NRG DMO - General Usage $ 1929.36

(17 rows)

Which brings me to my conclusion: my current retailer is the cheapest for my current generation and consumption patterns.


But we can go further. We can always go further.

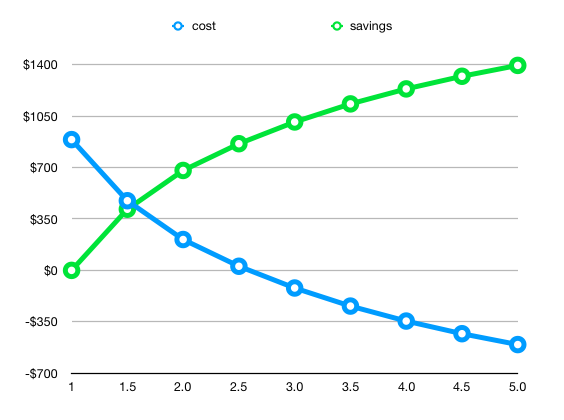
We can look at different months, and see if it’s always the case that a given retailer is the best option. Perhaps it is worthwhile shopping around, and switching between retailers at different times of the year.

CREATE OR REPLACE VIEW monthly_cost_comparisons AS

SELECT retailer.name, 
       to_char(date, 'YYYY-MM') AS month,
       SUM(cost(retailer, import::INTEGER, export::INTEGER)) AS cost
  FROM daily_summary, retailer
  GROUP BY retailer.name, to_char(date, 'YYYY-MM');

That by itself is not that useful, but we can use the crosstab feature to view it in a more readable manner.

CREATE EXTENSION IF NOT EXISTS crosstab;

SELECT * 
  FROM crosstab(
    $$SELECT name, month, '$ ' || lpad(cost::INTEGER::TEXT, 4)
       FROM monthly_cost_comparisons ORDER BY name$$, 
    'SELECT DISTINCT month FROM monthly_summary ORDER BY month'
) AS (
    "retailer" TEXT, 
    "2019-03" TEXT,
    "2019-04" TEXT,
    "2019-05" TEXT,
    "2019-06" TEXT,
    "2019-07" TEXT,
    "2019-08" TEXT,
    "2019-09" TEXT,
    "2019-10" TEXT,
    "2019-11" TEXT,
    "2019-12" TEXT
);

Frustratingly, this function requires enumerating the columns.

retailer 2019-03 2019-04 2019-05 2019-06 2019-07 2019-08 2019-09 2019-10 2019-11 2019-12
AGL Essentials $ 14 $ 41 $ 128 $ 200 $ 209 $ 223 $ 90 $ 1 $ 1 $ -10
AGL Residential Essentials $ 19 $ 45 $ 127 $ 196 $ 204 $ 219 $ 93 $ 10 $ 9 $ -5
AGL Solar Savers $ 15 $ 45 $ 143 $ 223 $ 233 $ 249 $ 100 $ 1 $ 0 $ -11
Alinta Energy No Fuss (Single Rate) $ 46 $ 72 $ 147 $ 216 $ 225 $ 242 $ 122 $ 47 $ 46 $ 13
Blue NRG DMO - General Usage $ 91 $ 125 $ 226 $ 329 $ 341 $ 371 $ 203 $ 103 $ 102 $ 38
Click Banksia Solar $ 20 $ 50 $ 144 $ 222 $ 232 $ 248 $ 104 $ 8 $ 8 $ -7
Diamond Energy Everyday Renewable Saver $ 47 $ 76 $ 166 $ 246 $ 256 $ 276 $ 135 $ 45 $ 45 $ 11
Energy Australia Total Plan Home $ 28 $ 57 $ 149 $ 228 $ 237 $ 255 $ 112 $ 19 $ 19 $ -2
Kogan $ 47 $ 69 $ 132 $ 191 $ 198 $ 213 $ 112 $ 49 $ 49 $ 16
Lumo Basic $ 22 $ 49 $ 134 $ 203 $ 212 $ 227 $ 98 $ 12 $ 12 $ -4
Origin Energy Econnex $ 46 $ 71 $ 143 $ 211 $ 219 $ 236 $ 120 $ 48 $ 47 $ 14
Origin Energy $ 17 $ 45 $ 136 $ 213 $ 222 $ 238 $ 98 $ 5 $ 5 $ -8
Power Direct Residential Saver $ 27 $ 52 $ 131 $ 198 $ 207 $ 222 $ 100 $ 21 $ 21 $ 1
PowerShop Shopper Market $ 44 $ 67 $ 133 $ 193 $ 201 $ 215 $ 111 $ 44 $ 44 $ 13
Powerband Home Flat + Solar FIT $ 31 $ 55 $ 126 $ 187 $ 195 $ 208 $ 98 $ 26 $ 26 $ 4
Red Energy Living Energy Saver $ 36 $ 63 $ 142 $ 212 $ 221 $ 237 $ 112 $ 32 $ 32 $ 6
SA Simply RAA VPP $ 23 $ 50 $ 135 $ 206 $ 215 $ 230 $ 99 $ 13 $ 13 $ -4

From this, I can see that nothing is really going to save me more than a few bucks a month: and this does not take into account the $200 “bonus” I get from AGL if I stick with them for a year (or something like that).

I’d also like to look at actual billing periods, because then I can see that everything matches up to what my actual bills are (and then I can add in the bonuses at the times they applied).

My billing periods went to monthly on a specific date, so from then on they are regular one-month periods, but prior to that they were a little all over the place:

CREATE OR REPLACE VIEW billing_periods AS 

SELECT 'AGL Essentials'::TEXT AS retailer,
       DATERANGE(start::DATE, (start + INTERVAL '1 month')::DATE) as period
  FROM generate_series('2019-06-24'::DATE, now()::DATE, INTERVAL '1 month') start
  
 UNION ALL
 
 VALUES ('AGL Essentials'::TEXT, '[2019-03-07,2019-06-01)'::DATERANGE),
        ('AGL Essentials', '[2019-06-01,2019-06-24)')
  
  ORDER BY period DESC;

We can model the retailer bonuses in a way that only applies them when they apply, and if we are calculating the costs for that retailer:

CREATE TABLE retailer_bonus (
  retailer TEXT, 
  billing_period DATERANGE, 
  bonus NUMERIC
);

INSERT INTO retailer_bonus(retailer, billing_period, bonus)
     VALUES ('AGL Essentials', '[2019-08-24,2019-09-24)', 25);

And now some views for calculating the actual costs for each day, and then aggregating within the billing periods (and a pretty version).

CREATE OR REPLACE VIEW actual_costs AS

SELECT retailer,
       billing_periods.period,
       daily_summary.date,
       cost(_ret, import::INTEGER, export::INTEGER),
       generation
  FROM billing_periods
 INNER JOIN retailer _ret ON (_ret.name = billing_periods.retailer)
 INNER JOIN daily_summary ON (daily_summary.date <@ billing_periods.period);
 
 
CREATE OR REPLACE VIEW billing_period_costs AS
 
SELECT retailer, 
       period, 
       SUM(cost) - COALESCE((SELECT SUM(bonus) 
                               FROM retailer_bonus 
                              WHERE billing_period = period
                                AND retailer_bonus.retailer = retailer.name), 0) AS cost, 
       SUM(generation) AS generation
  FROM actual_costs
 GROUP BY retailer, period
 ORDER BY period DESC;
 
 
CREATE OR REPLACE VIEW billing_period_costs_pretty AS 
SELECT retailer, 
       period,
       '$ ' || LPAD(TRUNC(cost, 2)::TEXT, 7, ' ') AS cost,
       LPAD(TRUNC(generation::NUMERIC / 1000, 1)::TEXT, 6, ' ') || ' kWh' AS generation
  FROM billing_period_costs
 ORDER BY period DESC;
 

And now, we can look at the actual bills, with generation for that period:

 SELECT * FROM billing_period_costs_pretty;
 
retailer period cost generation
AGL Essentials [2019-11-24,2019-12-24) $ -9.50  595.4 kWh
AGL Essentials [2019-10-24,2019-11-24) $ -1.20  879.0 kWh
AGL Essentials [2019-09-24,2019-10-24) $ 12.80  757.3 kWh
AGL Essentials [2019-08-24,2019-09-24) $ 104.30  610.6 kWh
AGL Essentials [2019-07-24,2019-08-24) $ 224.27  374.2 kWh
AGL Essentials [2019-06-24,2019-07-24) $ 210.24  302.8 kWh
AGL Essentials [2019-06-01,2019-06-24) $ 148.31  244.8 kWh
AGL Essentials [2019-03-07,2019-06-01) $ 183.65 1495.9 kWh

Note that the first row is the current month: it’s only partway through, so I will end up with even more of a credit than that, with any luck.

These values are all within a dollar or two of the amounts I was actually billed, so that is nice.


But wait, there is more!

We can use this, with just a couple more functions, to make fairly good estimates of what our outputs and costs would be if we had more panels.

But that one will have to wait for another day.

asyncpg and upserting bulk data

I’ve been doing some work on analysing the output of my PV system, and needed a mechanism for inserting large numbers of rows of data pulled from the Fronius API. Since I mostly work in python, I decided to use a python script to get the data from the inverter, but I needed a clean way to insert potentially lots of rows (every 5 minute period from every day: batched in 16 day blocks).

I’d normally just use psycopg2, but since I was using Python 3, I thought I’d try out asyncpg.

The API is quite nice:

import asyncio
import asyncpg

async def write():
    conn = await asyncpg.connect('postgres://:@:/database')
    await conn.execute('query', [params])
    await conn.close()

asyncio.get_event_loop().run_until_complete(write())

So, that part was fine. There are more hoops to jump through because async, but meh.

But I had an interesting case: I wanted to do a bulk insert, and I didn’t know how many records I was going to be inserting. It seemed like it was going to be a bunch of work to build up placeholder strings based on the number of rows, and the number of columns in each row.

But no, there is a function that works perfectly (and turned out to be even better, because it takes an argument as to the name of the table):

    conn = await asyncpg.connect(...)
    await conn.copy_records_to_table(table, records=values)
    await conn.close()

That was really easy. It’s a requirement that each row of values is in the same order as the table definition, but my tables in this case were simple.

But there’s one catch: this works great for inserting data, but what about when some of that data is already present. We want to insert some rows, but update others: upsert. Postgres supports this using the ON CONFLICT ... DO ... syntax. So, how can this work with the bulk insert (that uses the Postgres COPY command under the hood)?

    # Our table just contains two columns: timestamp and value.
    await conn.execute('''CREATE TEMPORARY TABLE _data(
        timestamp TIMESTAMP, value NUMERIC
    )''')
    await conn.copy_records_to_table('_data', records=values)
    await conn.execute('''
        INSERT INTO {table}(timestamp, value)
        SELECT * FROM _data
        ON CONFLICT (timestamp)
        DO UPDATE SET value=EXCLUDED.value
    '''.format(table=table))

Sweet.

We can use the string formatting tools here because the table name is controlled by us, so there is not an SQL injection vector to worry about. You should not do this if that value could be coming from a user though.

But there is one problem. We are updating rows, even if the value has not changed. If you don’t think too hard, that’s probably fine. But the way postgres works is that it rewrites every row that has “changed”, even if it hasn’t really changed. It marks the old row as superseded, and that space will not be reclaimed until the table is vacuumed.

Instead, we should be able to just ignore those rows that have the same value (which, in my case, should be all rows except the last one, as that is the only one that should have different data).

    await conn.execute('''
        INSERT INTO {table}(timestamp, value)
        SELECT * FROM _data
        ON CONFLICT (timestamp)
        DO UPDATE SET value=EXCLUDED.value
        WHERE {table}.value <> EXCLUDED.value
    '''.format(table=table))

Oh nice: Postgres also supports a WHERE clause on the DO UPDATE clause.

Fronius Dashboard

Last January, I had some solar panels installed. The inverter I chose was a Fronius Primo, which is a relatively well thought of piece of equipment.

It comes with access to Solar.Web, which is Fronius’ online portal. Using this, you can get realtime access to your power generation, and hourly updated energy generation for the current day. They also have an Apple Watch app (and iPhone, naturally).

Additionally, I configured PVOutput, which gives me generation stats with a five minute resolution.

Shortly after, I decided to have a Fronius Smart Meter installed, which gives me realtime access to feed-in and feed-out data. This matches up fairly well with the SA Power Networks smart meter data: which is only available a day or so after the fact. I wish I’d had this installed from day one.

One of the key things I wanted to be able to do was have an easily readable display that shows how much power we are generating (and how much energy we have generated today), but also the current consumption, and the feed in or out right now.

After a bit of work, I came up with a (what I think is) really nice UI. I wrote it using Elixir: mainly because I wanted to write something using Phoenix LiveView. It’s actually a bit too much like Rails for me to want to use it frequently, but I do wish there was something a bit like it for Django.

Anyway, enough of the technology choices, let’s look at the dashboard:

Fronius Dashboard: Daytime View

The data is updated every second; and at night time, it goes into a dark mode:

Fronius Dashboard: Nighttime View

Like most of my side projects, this is freely available. You can install this now on any device that runs Docker, as long as it’s amd64 or arm. I’ve built it on a Raspberry Pi 3B+, but I think it should also work on a Raspberry Pi Zero.

$ docker run -it -p 4000:4000 \
    --restart unless-stopped \
    --name fronius-dashboard \
    --env INVERTER=<ip-address-or-hostname> \
    schinckel/fronius-dashboard:latest

This should download the latest version, and start it up. You will need to supply your own inverter’s IP address or hostname: but if you have fronius.lan as the hostname, then you can omit that line.

To make it available outside of your network, you’ll need to forward something to port 4000 of the device that is running this service. I have the aforementioned rPi3B+ running this, an MQTT broker and Node-RED, and my MQTT2HomeKit bridge, and expose only the Fronius Dashboard service to the internet.

It’s also designed to work well as a home screen app on iOS, and possibly Android devices.

There is no warranty, implied or otherwise as to the fitness of this to your purposes, but if you are nice, I’ll try to fix any bugs. You can view the source code at Source Hut.

I’m not sure how it will handle not having a Smart Meter installed.

I’ll also be more than happy to try to make this work with other inverters.


I’ve also been playing around with using nerves-project to build a standalone image that can be burned to a RaspberryPi Zero, but I’m still working through some kinks related to being able to configure that. I’m hoping to have that as a turn-key solution that I can install into some friends who have/are purchasing Fronius inverters.

Basically, I need a mechanism for storing the WiFi credentials on the nerves board, and allow configuring the IP address/hostname of the inverter. I got partway through an admin UI, but it’s not really complete yet.

NodeRED Coffee Grinder Redux

I built a Node-RED flow for my Coffee Grinder. There was a very subtle bug.

There are four ways that you can start the grinder:

  • Trigger an HTTP Request for a Single
  • Trigger an HTTP Request for a Double
  • Start the grinder manually using the button on the socket
  • Start the grinder using HomeKit or MQTT

This is all fine, and 18 seconds after a manual trigger, the grinder will turn off.

Except, if you manually stop the grinder, and then restart it before the initial 18 seconds has elapsed, it will still turn of at that 18 second point. Which, whilst probably okay, is still frustrating.

What I wanted to do instead is “cancel” a flow, if the switch is turned off (in any way).

It turns out there is a way to use the “Trigger” node to get this behaviour:

trigger

This allows me to simplify the flow, because the values I need to turn things on and off (1 and 0) are the same ones we want to use to trigger and reset.

coffee-flow

I found I needed to respond to the HTTP request from Siri Shortcuts immediately, because the timeout appears to be shorter than my grind time. It would have been nice to be able to respond when the grind had finished: perhaps I could do something where it returns bytes once per second until it’s done, but for now, this works great.


It actually got me thinking: I wonder how maintainable a really complex project would be in Node-RED.

Cascading Selects: Leaf Node Only

I’ve written quite a lot of stuff about trees in Postgres, but not quite so much about how they might be used. One situation where they could be used is in categories: where each category may have sub-categories, and those may or may not have further sub-categories. When editing an object that has a single category, it would be useful to only show the values at each level, and then making a selection results in the display of another select element, that only has those values that apply at that level, and with that chain of parents selected.

Changing a selection should remove all subsequent items, and redisplay the “next” select with the new available options.

As you select different options from the “Category” select, you will see that only the leaf node is shown in the box on the right: but also (to show that it’s not just rendering the last value), we have a second “category” key/value pair from the text input.

This is a bit of a proof of concept: it doesn’t actually do an AJAX request: although there is a commented out fetch() request that shows where this would occur, but it doesn’t include the current selection.

The responses from the server would need to look something like:

[
  {"value": 8, "label": "Eight"},
  {"value": 9, "label": "Nine"},
  {"value": 10, "label": "Ten"},
  {"value": 11, "label": "Eleven"}
]